
I wrote about my thoughts on the MLB Dashboard a few weeks ago. I've been working hard on it and am about to introduce something.
In 2021, some friends introduced me to Beat the Streak ("BTS"), an online game in which you have to predict (guess) a successful batter for 57 straight games.
My first thought was, "Interesting, but no one will win it." But my friends enjoyed it, so I played for several weeks. I realized I didn't have enough information to play. Just picking your favorite couple of players didn't cut it.
So, I decided to create some type of database with a dashboard. After weeks of development, my BTS results greatly improved. My best streak of 26 or 29 games (I don't remember), is considered very good (but nowhere close to 57). It was now more fun to play.
Now, let's be clear. I'm not using machine learning or fancy-pants analytics. There are too many variables for anyone to get 57 games. The highest score was 2 people getting 51 straight batters. So, if this is your retirement plan, think again.
However, I loved developing the analytics piece of the puzzle. Instead of making winning BTS my primary goal, it's now my nth goal. My primary goal is to create an MLB dashboard that assists people with statistics. My primary goal is to create an MLB dashboard that assists people with the current day's game statistics. I plan to post a file when I can (I would like to take a vacation sometime) to provide you with a wealth of stats.
These screenshots are small, so you might have to download and open the file at the end of this blog entry and follow along.
Daily Batter Matchups
This dashboard is developed for people playing Beat the Streak.
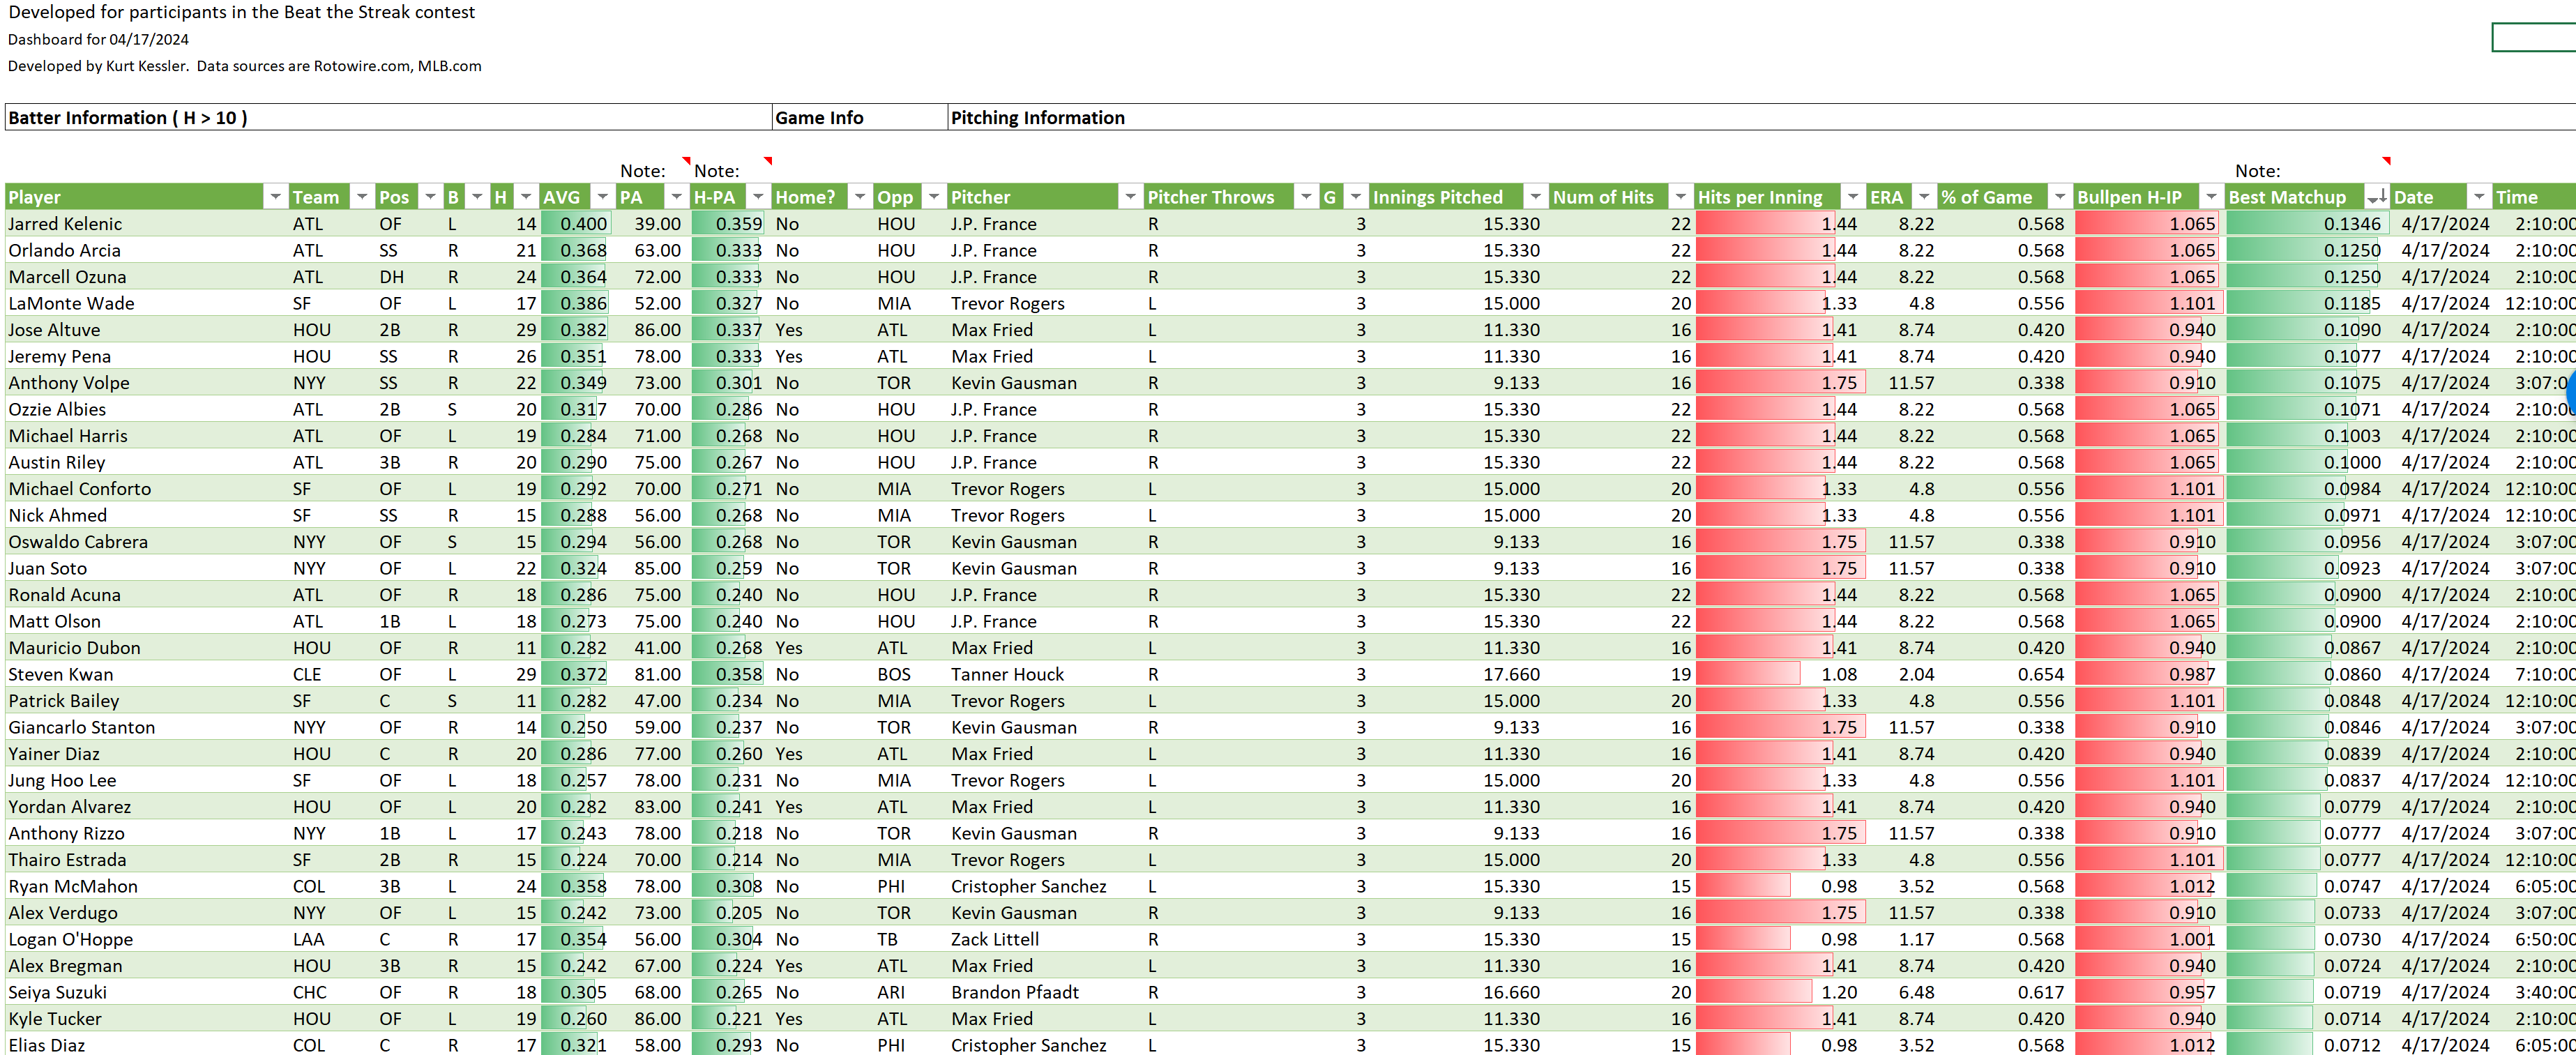
This daily batter screenshot shows which batters may perform best against the starting pitcher and the team's bullpen. This is a screenshot of the games on 4/17/24. Jarred Kelenic from ATL hits L and has 14 hits with a .400 Avg. I don't care about Avg, but I left it in for now. I really care about plate attempts (PA) and hits per plate attempt (H-PA), which are hits / (at bat + base on ball + hit by pitch + sacrifice fly + sacrifice Bunt). ATL is playing HOU, who has J.P. France as their starting pitcher. France throws right and has started in 3 games for a total of 15.33 innings. He has 22 hits against him. His Hits per Inning is 1.44 with a ERA of 8.22. He pitches 56.8% of the game (% of Game). So, I need to calculate the bullpen stats as well. The bullpen has 1.065 H-IP (Hits per Inning Pitched). So I came up with a statistic that I call for now Best Matchup, which is defined as:
H-PA * ((Starting Pitcher's Hits per Inning * % of Game) *
        (Bullpen H-IP * (1 - % of Game)))
I do this for everyone hitting on 4/17/24 with more than 10 hits. Then I sort Best Matchup descending. I hypothesize that this tells me who the best hitters face the "worst" pitchers.
Type of Hits
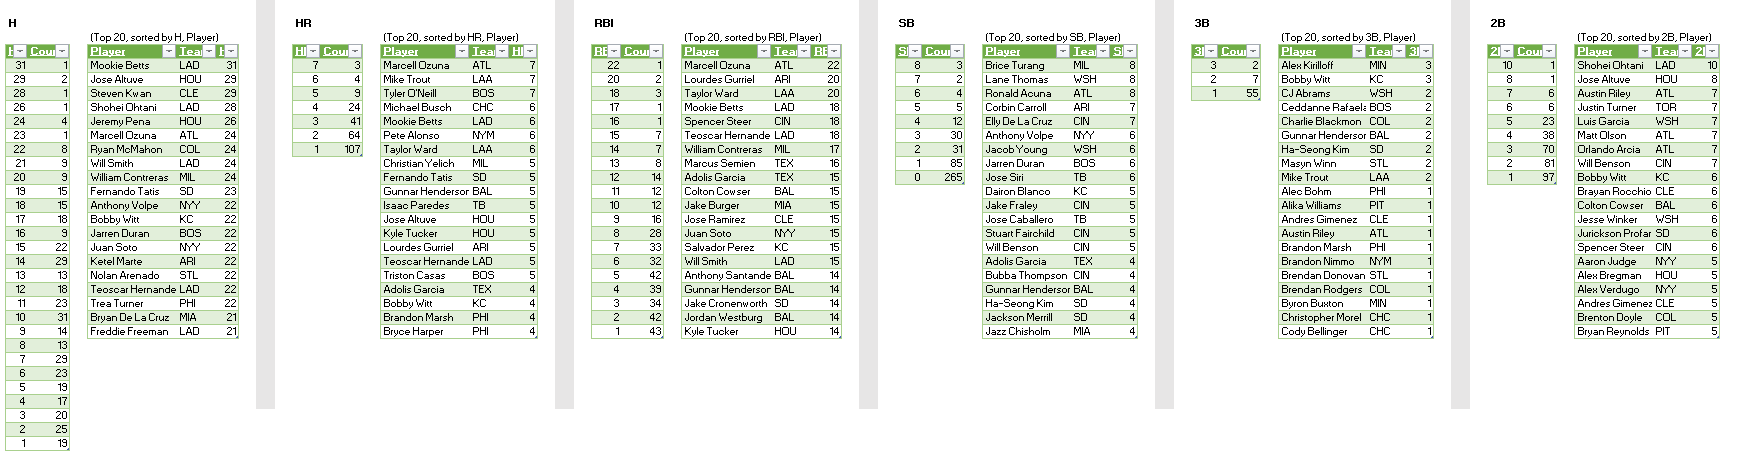
This exhibit details who is leading in Hits, HR, RBIs, Stolen Bases, Triples, and Doubles with the corresponding frequency distribution.
Games
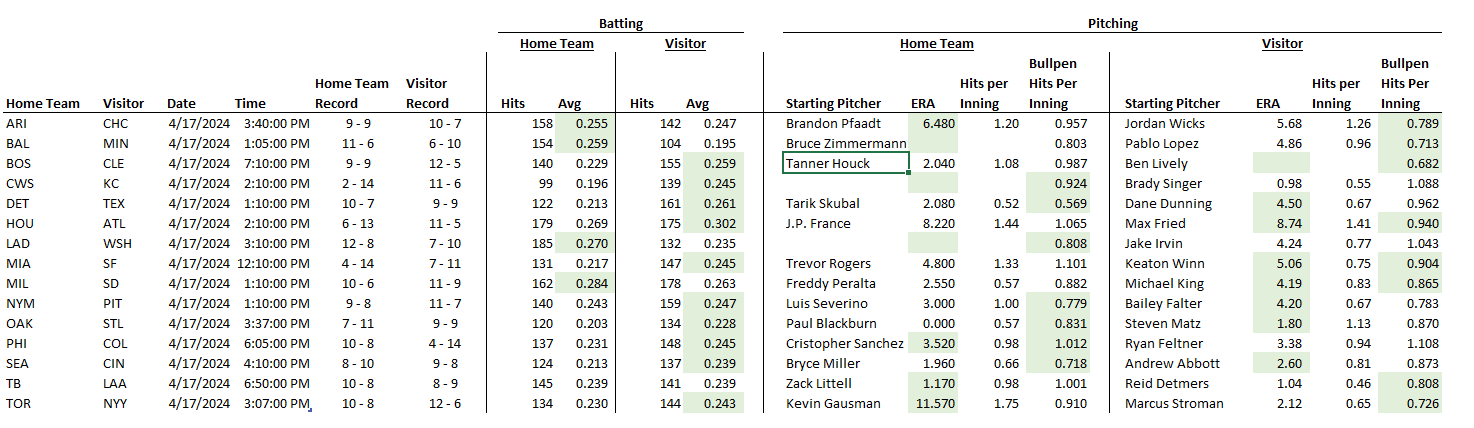
This exhibit shows you who is playing today, their records, and some high-level batting and pitching stats. (Ignore the blank values in the exhibit. They will be fixed in the next couple of days.)
Batter Stats, Batting Stats - Team, Pitcher Stats, Pitcher Stats - Team
These exhibits are pretty self-explanatory. They are updated daily.
2023 Stats
There are two tables here. They have the batting stats and the pitching stats for 2023.
Attached is a draft of the file.


